 |
QI-SFR10-P-RM SFRplus Chart on Photographic Paper

| Model | SFRplus |
| Type | Reflective |
| Format | Custom Designs |
| Size | 223mm x 356mm |
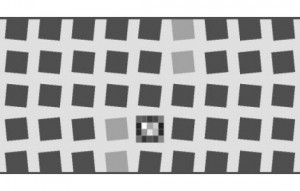
The SFRplus test chart can be used with the SFRplus module in Imatest 3.2 or later to measure MTF, lateral chromatic aberration, distortion, and tonal response. The SFRplus module features fully automated region-of-interest detection.
The SFRplus chart offers significant advantages over commonly used charts such as the ISO 12233 chart, including
SFRplus charts on photographic paper have the following properties:
Test card customization
According to customer demand for production,transmission can be customized.
About Us Contact Us Focus on Color Global Agents Site Map
Link:colorimeter Color Assessment Cabinets pecolor iQstest spectrophotometer
© 1998~2025 ColorController, Incorporated. All Rights Reserved.