 |

This chart, and all our ink jet printed charts have an approximate MTF50 of 5 cycles/mm. Please keep this in mind when choosing the size of chart. Using a chart that is too small with a high-resolution sensor can result in the MTF of the chart degrading the measured MTF of the camera system. In addition, it is important to use a chart that is large enough to accomodate the minimum focus distance, as well as the resultion of your sensor.
Charts are available in tfive main sizes with variations depending on the grid dimensions selected. It is recommended that the medium sized charts be used to test imaging systems with sensors up to 12 MP, the large charts be used for testing of sensors above 12 MP and up to approximately 24 MP, and the extra-large charts be used for sensor sizes above 24 MP.
Paper Size (Including Margin)
| Square Dimensions | ||
|---|---|---|
| 5x9 | 5x7 | |
| X-Small | 8.5" × 15" | 8.5" × 10" |
| Small | 14" × 24" | 14" × 20" |
| Medium | 24" × 40" | 24" × 34" |
| Large | 44" × 60" | 44" × 60" |
| X-Large | 44" × 74" | 44" × 64" |
Active Area
The active area of the chart includes white space above and below the top and bottom distortion bars. It is slightly larger than the printed area, which is bounded by the distortion bars on top and bottom. White space is included in active area because test images of the chart must include this white space in order to enable automated processing in SFRplus software.
| Square Dimensions | ||
|---|---|---|
| 5x9 | 5x7 | |
| X-Small | 7.85" × 15" | 6.75" × 10" |
| Small | 12.5" × 24" | 13.5" × 20" |
| Medium | 22" × 39.22" | 22" × 33" |
| Large | 33" × 59" | 40" × 59" |
| X-Large | 42" × 72" | 42" × 59" |
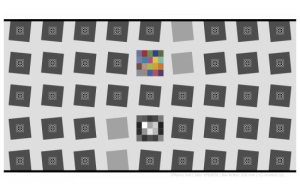
Inclusion of the color chart enables testing of color accuracy. If the color option is selected, the "focus star" pattern that aides in focusing is replaced by a 20 patch color chart.
Pre-distorted charts offer the ability to map the outer edges of a wide angle or fisheye lens using SFRplus. These distortion levels are available
| Level | Matrix (5x7) | Matrix (5x9) |
|---|---|---|
| No distortion | [0 0] | [0 0] |
| Distort | [0.833 1.123] | [0.833 1.375] |
| Distort+ | [1.167 1.577] | [1.167 1.982] |
| Ultradistort | [1.333 2.313] | [1.333 2.958] |
About Us Contact Us Focus on Color Global Agents Site Map
Link:colorimeter Color Assessment Cabinets pecolor iQstest spectrophotometer
© 1998~2025 ColorController, Incorporated. All Rights Reserved.